Instructions
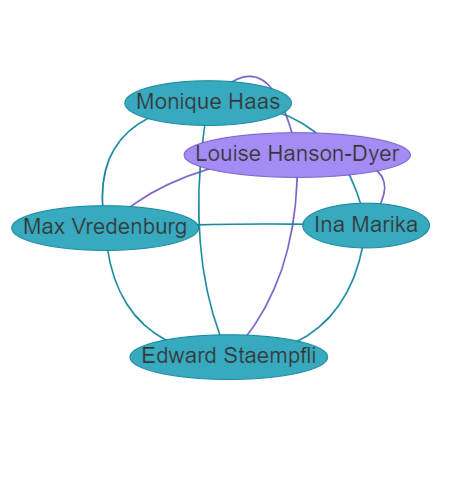
In the visualisation, information is divided into:
Nodes – the bubbles representing each figure
Edges – the lines representing connections between nodes
Create a map by selecting from two drop-down boxes. The first allows you to select from four categories: Nationalities, Roles, People & Groups, or Relationship Types. The second allows you to refine your search – either type directly into the search field or select from the drop-down list. You can select multiple options from the list, but in well-represented areas this may overcrowd the map.
Please note, crowded maps can take a moment to settle. Once they’ve done so, you can manipulate the position of nodes by clicking and dragging them.
Your results can be filtered by toggling the following to Yes or No:
Show nodes related to selection – displays a secondary tier of individuals and groups related to your initial search
Show edges related to Hanson-Dyer – displays each node’s link to Hanson-Dyer
Click on individual nodes to see further information on the right-hand side of the page.
For ease of reference, you can opt to colour nodes by nationality, role or gender.