Political Rhetoric Project
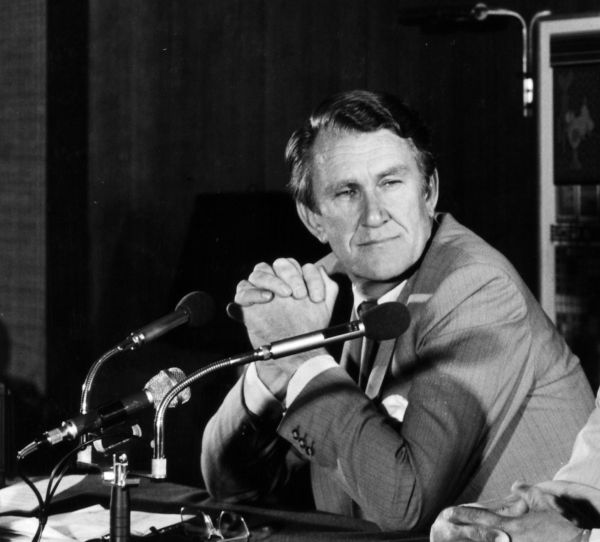
Almost every week between 1954 and 1983 former Prime Minister Malcolm Fraser gave speeches broadcast over local radio stations to his electorate in the Western district of Victoria, Wannon. The transcripts of over 700 of these speeches are now held in the Malcolm Fraser Collection at the University of Melbourne Archives (UMA). They cover a huge range of topics, from foreign policy to political philosophy to agricultural concerns to early discussions on racism. Their breadth and number make them a unique resource to understand the political trajectory of a former Prime Minister, and the development of political rhetoric over three decades.
In 2022, a joint project between the Melbourne Data Analytics Platform, the Faculty of Arts Digital Studio and UMA sought to create analytical tools for the radio talk text. We used a methodology of natural language processing called topic modelling to identify significant topics and perform temporal analysis in order to better understand Fraser's political rhetoric. We believe that these tools may be used on similar corpora of political rhetoric and hope that others can make use of them in the future.
Below is an outline of the corpus and the tools used.
-
Documents
This project emerged from one of the main questions asked of Malcolm Fraser's political career - did he change his political perspectives over time? The transcripts of Fraser's electorate radio talks are a unique source of data we can use to attempt to answer this complex question.
The original transcripts were typed by Fraser before he recorded the speeches for distribution. They have been digitised and run through Optical Character Recognition.
One decade of speeches, 1960-1970, was selected as it was found that there were still significant errors in the OCR text that required manual correction. Clean data is fundamental to any natural language processing project but it can present a challenge when working with scanned typescript. We hope to expand this selection in the future by looking at machine learning tools for text correction.
In the graph below we can see how the frequency of speeches (documents) changed over time, or at least which ones had found their way into the archive. While for most of the years we have a total of around 40 – 50 speeches, there are some years that don’t fit that average. In particular, 1960 has fewer than 5 documents and 1967 has over 90. Again, in natural language processing projects, it is important to have a clear understanding of the parameters of the corpus and its idiosyncrasies when drawing conclusions from the output.
Number of documents per year -
Topic Modelling
In order to answer the temporal question, we first need to understand the topics he shared with his electorate in his radio talks. We used a machine learning approach called topic modelling to identify the most relevant and frequent topics.
Topic modelling is an unsupervised machine learning technique that is capable of detecting word and phrase patterns, and automatically cluster word groups and expressions to characterise a corpus. It provides a means to reinforce our intuition that words such as ‘play’ and ‘performance’ often coincide with words like ‘audience’ and ‘theatre’ in a document, rather than ‘invasion’ or ‘explosion’. That’s not to say that these terms never would – a theatre review of “War of the Worlds” would have such terms in the same document. However, given a document collection, we would likely find that these 6 words would naturally form 2 clusters – one cluster with terms pertaining to ‘the arts’ and one cluster around ‘war’ – which we would refer to as “topics”.
There are a number of ways we can determine these clusters of terms and we have used a method called LDA (Latent Dirichlet Allocation) because it helps us discover a couple of things about a document collection. It provides us a way to uncover which terms have a propensity to be collocated together – these are our “topics” – but additionally it models how these topics are distributed over the document collection. We can discover which topics are talked about together and in what proportion throughout the document collection. This is a valuable feature in describing a compilation of related texts, as we have done with Malcolm Fraser’s radio speeches.
In building a model one of the key factors to determine is the optimal number of topics to extract from the speeches in order to extract topics that are unambiguous, distinct and sensible. There are certain measures that help determine the right value for this hyperparameter, such as topic coherence. For this project we leveraged our domain knowledge to identify the right number of topics. We started by using a grid search approach and came up with 4 models that contained 10, 30, 60 and 90 topics. Subject matter experts concluded that the 60 topic model had the most topics that were both granular and concise enough to become categories of their own without overlapping too much. They have labelled these topics on the interactive graph below.
In the topic model we have created for Fraser’s speeches, each word in a speech is attributable to one of the 60 topics, and each speech contains a number of these identified topics. However each of these identified topics is weighted differently. So when we choose the highest weighted topic for a speech, we identify the dominant topic. When it comes to visualising these speeches, we use a specific approach of dimensionality reduction called t-distributed stochastic neighbor embedding on the topic distribution for the speeches. This allows us to visualise those speeches in a 2 dimensional space as shown in the interactive graph below.
How to use this interactive visualisation:
This visualisation is a means to test the veracity of the model we have used to analyse the data; did our model extract relevant and coherent topics? If the topics are in general grouped together, and also if they are somewhat co-located with similar topics then the model is working well.
Move your mouse over the coloured dots. Each dot represents a document that has been placed into a weighted topic by the model. The pop-up shows the title of the speech and the topic label ("category"). You'll notice that the topics are largely clustered together: Portland Wool Sales in red on the far right, Vietnam War in the bottom center.
Also note that related topics tend to be located near these topics: Primary Export Industry is close to Portland Wool Sales, South East Asia is close to Vietnam. Again, this is an indication that the model developed is a good representation of the data.
To see the spread of all the documents in one category double-click on the category label on the right. That allows you to see how coherent any one topic is within the model. You can also jump to any document plotted on the visualisation by double-clicking on the dot.
-
Topic Analysis
This section focuses on analysing the frequency of topics over the decade 1960-1970. The graph below shows the frequency of the topics where they have been the dominant one for a speech.
This fairly simple visualisation shows us some useful points about Malcolm Fraser during this decade. The Vietnam War is easily the most frequent dominant topic, indeed it is three times more frequent than any other topic. Malcolm Fraser was Minister for the Army between 1966 and 1968, which can explain this predominance to some extent (see below for more discussion around the temporal analysis). But he was also Minister for Education between 1968 and 1969, and that topic appears far less frequently. Both the Vietnam War and education reform were controversial and prominent topics during these years. So it would appear that it is not solely his ministerial responsibilities that determined which topics he spoke about to his constituents.
The next most dominant topic is Parliament, a label given to speeches that sought to explain procedures or events that take place within Parliament. Then there are a series of topics that could be described as local or rural affairs; Wannon was a country district with a high portion of farmers (including Fraser's family). Overall, it looks like Fraser's messages to his constituents over that decade were a mix of international affairs, ministerial duties and parliamentary issues, and rural/local issues. Given that Fraser was a backbencher for just over half the decade and had a rural constituency, this mix of topics might be considered surprising. It demonstrates that Fraser held a keen interest in international affairs and wished to discuss them with his constituents from early in his career.
-
Timeline of Historical Events
Now we will turn to a temporal analysis of the topics. To help with this we produced a timeline of significant events. The decade after 1960 saw significant change in Australian society that is not fully captured by the timeline events. Coming out of the 1950s, social change began apace and the turmoil for which the 1960s is known internationally was reflected in Australia.
There were four federal elections during the decade, all of which were won by Fraser's Liberal Party. One of the most defining topics of the era was the Vietnam War and conscription. The Prime Minister Robert Menzies passed the National Service Act in 1964 and announced the first shipment of troops to Vietnam in April 1965. There were also significant changes to the White Australia immigration policy, the 1967 referendum on the constitutional recognition of Indigenous people, and two major changes in education funding leading to increased government support to non-government schools. On a local level, Fraser intervened into a dispute around the sale of wool at Portland in 1961-62 and there were widespread changes to agriculture, both environmental, technical and policy-based.
This sweep of issues is often reflected in the radio speeches.
-
Temporal Analysis
So now let's look at how the dominant topics changed over time as shown by this interactive visualisation. Each coloured line represents one of 30 topics. To remove a topic from the visualisation, click once on its label on the right. To focus in on one topic double-click on it instead.
The most obvious aspect of this graph is the spike in discussions of the Vietnam War, beginning in 1964, the year that the National Service Act was passed. Between 1966 and 1968 it is by far the most frequent topic, which coincides with his term as Minister for the Army. By 1967, 30% of the discussion is about the Vietnam War despite that year also being the year with the most speeches recorded.
If we remove Vietnam from the graph, no other single topic dominates over time. There is an interesting consolidation of topics (defence policy/equipment, parliament, education, and foreign policy) in 1969, but for the rest of the period it seems most of the topics were generally quite stable and almost equal in distribution. There is certainly some overlap between the timeline and the temporal topic distribution. We finally see some correlation here with his time as Minister for Education, with a spike in the education topic in 1969, the year that he announced substantial changes to federal funding for non-government schools.
The temporal analysis seems to confirm what the topic modelling had suggested; that Fraser spoke to his constituents regularly about a range of topics over time. That might sound like an obvious statement, but in some senses it is what the graph is not showing that is the interesting feature. This time period saw Fraser move from being a very young backbencher from a rural electorate to a minister with experience of several portfolios, a national profile and soon to challenge successfully for party leadership. Therefore, one might have expected to see a a clear topic trend towards issues that might be considered to be of more national or international significance. With the exception of the early discussions of the Portland wool sales and marketing, this was not the case.
-
Hierarchical Analysis
From the temporal analysis described above, we realised that we needed to re-categorise the topics in order to fully answer the question of whether Fraser's topics changed over the early development of his political career. So we developed two conceptual hierarchies to consolidate the categories we had drawn out of the original 60 topics; one geo-political and one theme-based.
Let’s look at the geo-political hierarchy first. The second tier categories are International, National and Regional. This pie chart is showing the number of topics within each category, bot the number of speeches based on those topics. These graphs show a fairly even split in terms of the scope of each category - that there were a broad range of topics in the international and national spheres that Fraser spoke to his constituents about.
With the second hierarchy, we broke the topics into politics, economics and administration (meaning topics that didn't seem overtly political, such as the development of the national capital city).
Clearly these topics are concomitant (eg industrial relations is both an economic and a political topic, national service is both a national and international topic), but for the sake of distinguishing trends over time, we sought to distribute them as best we could based on our understanding of each of the 60 topics identified by the model.
From the visualisation of the topics based on the hierarchy, we can again that there was no significant change in the nature of Fraser's radio talks. In every year except 1963, and then only by a small margin, he spoke more about international topics than national topics, and far less about regional ones. Until 1968 there seems to be a very small uptick in the discussion about international topics but that falls dramatically at the end of the decade. This visualisation seems to confirm the previous ones.
The theme-based hierarchy has a more noticeable decline of economics-themed topics, ending the decade with a big gap between topic themes that are political and those that are economic. This analysis is somewhat unexpected, given the topics placed into the economic category are ones that generally retained relevance over the decade.
Conclusion
Using the tools we have developed through this project we can conclude that during his early political career, Fraser's political rhetoric for his constituency was remarkably broad and consistent. He had an early focus on international affairs, which solidified during Australia's entry into the Vietnam War. The focus on international affairs may have been a reason why his discussion of economic matters dropped over the decade.
In the initial building of the model, there were few topics that centred around emotional or value-laden words or phrases. This would suggest that Fraser's political rhetoric was fairly measured, and centred on issues or events.
The tools that we developed for topic modelling, temporal, and hierarchical analysis are freely available on GitHub here. We hope that researchers looking at questions of political rhetoric find them useful and build on them. They could be of use to researchers looking at the Museum of Australian Democracy's Election Speeches dataset, or the large set of Prime Minister's speeches available through PM Transcripts.
In the future we hope to expand the analysis to the remaining two decades of speeches. In order to do that we need to build machine learning tools for text correction for the remaining two decades of speeches to avoid the need for time-consuming manual data correction. In the meantime, we hope that this project has shown that tools like natural language processing and topic modelling can be valuable to scholars of Australian politics and political rhetoric.