Visualise Your Data (repeat session)
Due to popular demand, this session from Researcher@Library Week is being repeated.
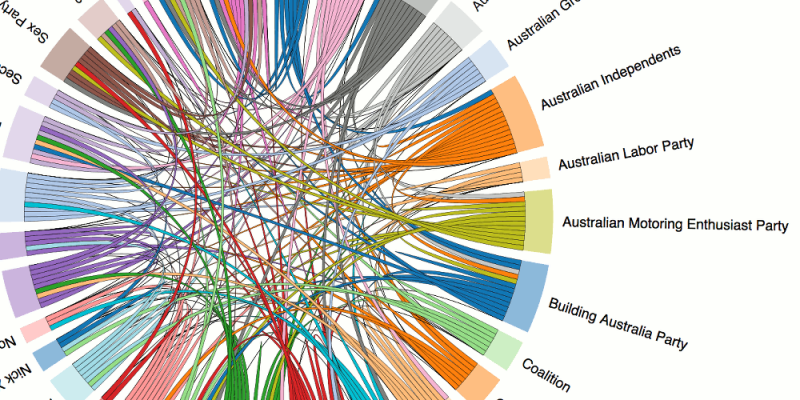
Creating visualisations of your research data can provide innovative ways of communicating and engaging with your research. This session will look at some of the techniques and tools for visualising research data, as well as how data visualisations can be used to analyse, contextualise and better understand your data.
Presenters: Dr Arif Jubaer (SCIP), Errol Lloyd (ResBaz)
Dr. Arif Jubaer is a Socio-Informatician at the SCIP platform of the University of Melbourne. He completed his PhD in Information Technology at the University of Melbourne. He has been working as a consultant in data management and analysis for Australia's biggest industries, such as ANZ, Coles, Medibank, Toyota and Bunnings Warehouse, among others. He is the founder of Daily Positive (D+) - a non-profit news media that publishes positive news on each country of the world.
Errol Lloyd graduated from the University of Melbourne with a Bachelor of Laws, Bachelor of Science and Diploma of Classics. He sought to pursue his scientific interests by undertaking a Masters of Vision Science and is now undertaking a PhD on visual neuroscience. He is works at the Research Bazaar in Research Platforms where he teaches and consults researchers on the use of web-based tools in the generation of interactive, effective, open and sharable visualisations.